$memhgs

Something is eating your memory. Find out who: helpers, renderers, and all.

Install How to use Docs GitHub
memhogs · zsh

↑ this terminal is live. Click the flags to run each mode. --watch actually watches.

01Install

Prebuilt binaries, no Go required. Pick your platform; on a Mac, brew is the one you want.

brew install cicerothoma/tap/memhogs

On Linux, use the packages above or a tarball. Tarballs for every platform are on the releases page, and the README walks through every option.

On a phone? There is an Android app too, with its own install walkthrough below.

02Your process list is lying to you

Watch what happens when 17 anonymous processes meet a process tree.

17 processes. Which app owns what? Good luck: one of them is a browser named stable.

03What it does

├─

Groups by owner

Walks the process tree so every helper, renderer, and language server rolls up into the app that spawned it. One app, one row, one total.

.app

Real names

Resolves the .app bundle on macOS and the systemd unit on Linux. Warp shows up as Warp, not as a binary called stable.

Honest numbers

Memory footprint on macOS (the Activity Monitor metric), PSS on Linux. Shared memory is never counted twice. Plain RSS is one flag away.

$_

Your jobs stay yours

The tree walk stops at interactive shells, so the 4 GiB training run you launched from a terminal tab shows as python3, not as your terminal.

{ }

Scriptable

JSON output with raw byte counts for dashboards and alerts. Filter by name, cap the list, or watch it live.

2.2M

Small and fast

One static binary for macOS and Linux, amd64 and arm64. No runtime, no config, no dependencies.

04How to use it

Run memhogs and read the top of the list. Everything else is a flag, and every mode below is runnable in the live terminal at the top of this page.

memhogs

Every app and service, largest first. Groups expand to their five biggest processes; the footer tells you the metric and the machine total.

memhogs --compact

One row per app, no member processes. The quickest answer to "who is eating my RAM".

memhogs --tree

Every member process of every group, when you need to know which renderer is the 2 GiB one.

memhogs --flat

Raw processes ranked like top, but with real names and the fair metric.

memhogs slack

Any extra word filters by name, case-insensitive. Works with every mode.

memhogs --watch

Full-screen live view, like top: repaints in place, fits your window, restores the terminal on ctrl-c. --interval 5s changes the pace.

memhogs --json

The full structure with raw byte counts, for scripts, dashboards, and alerts.

memhogs --rss

Switches to the number ps and top report, for comparing against those tools.

Full documentation, with real captured outputs for every command, lives in the README.

05memhogs for Android

The same idea in your pocket: every app ranked by honest memory, helpers grouped under the app that owns them, and a safe reclaim button that reports exactly how much came back.
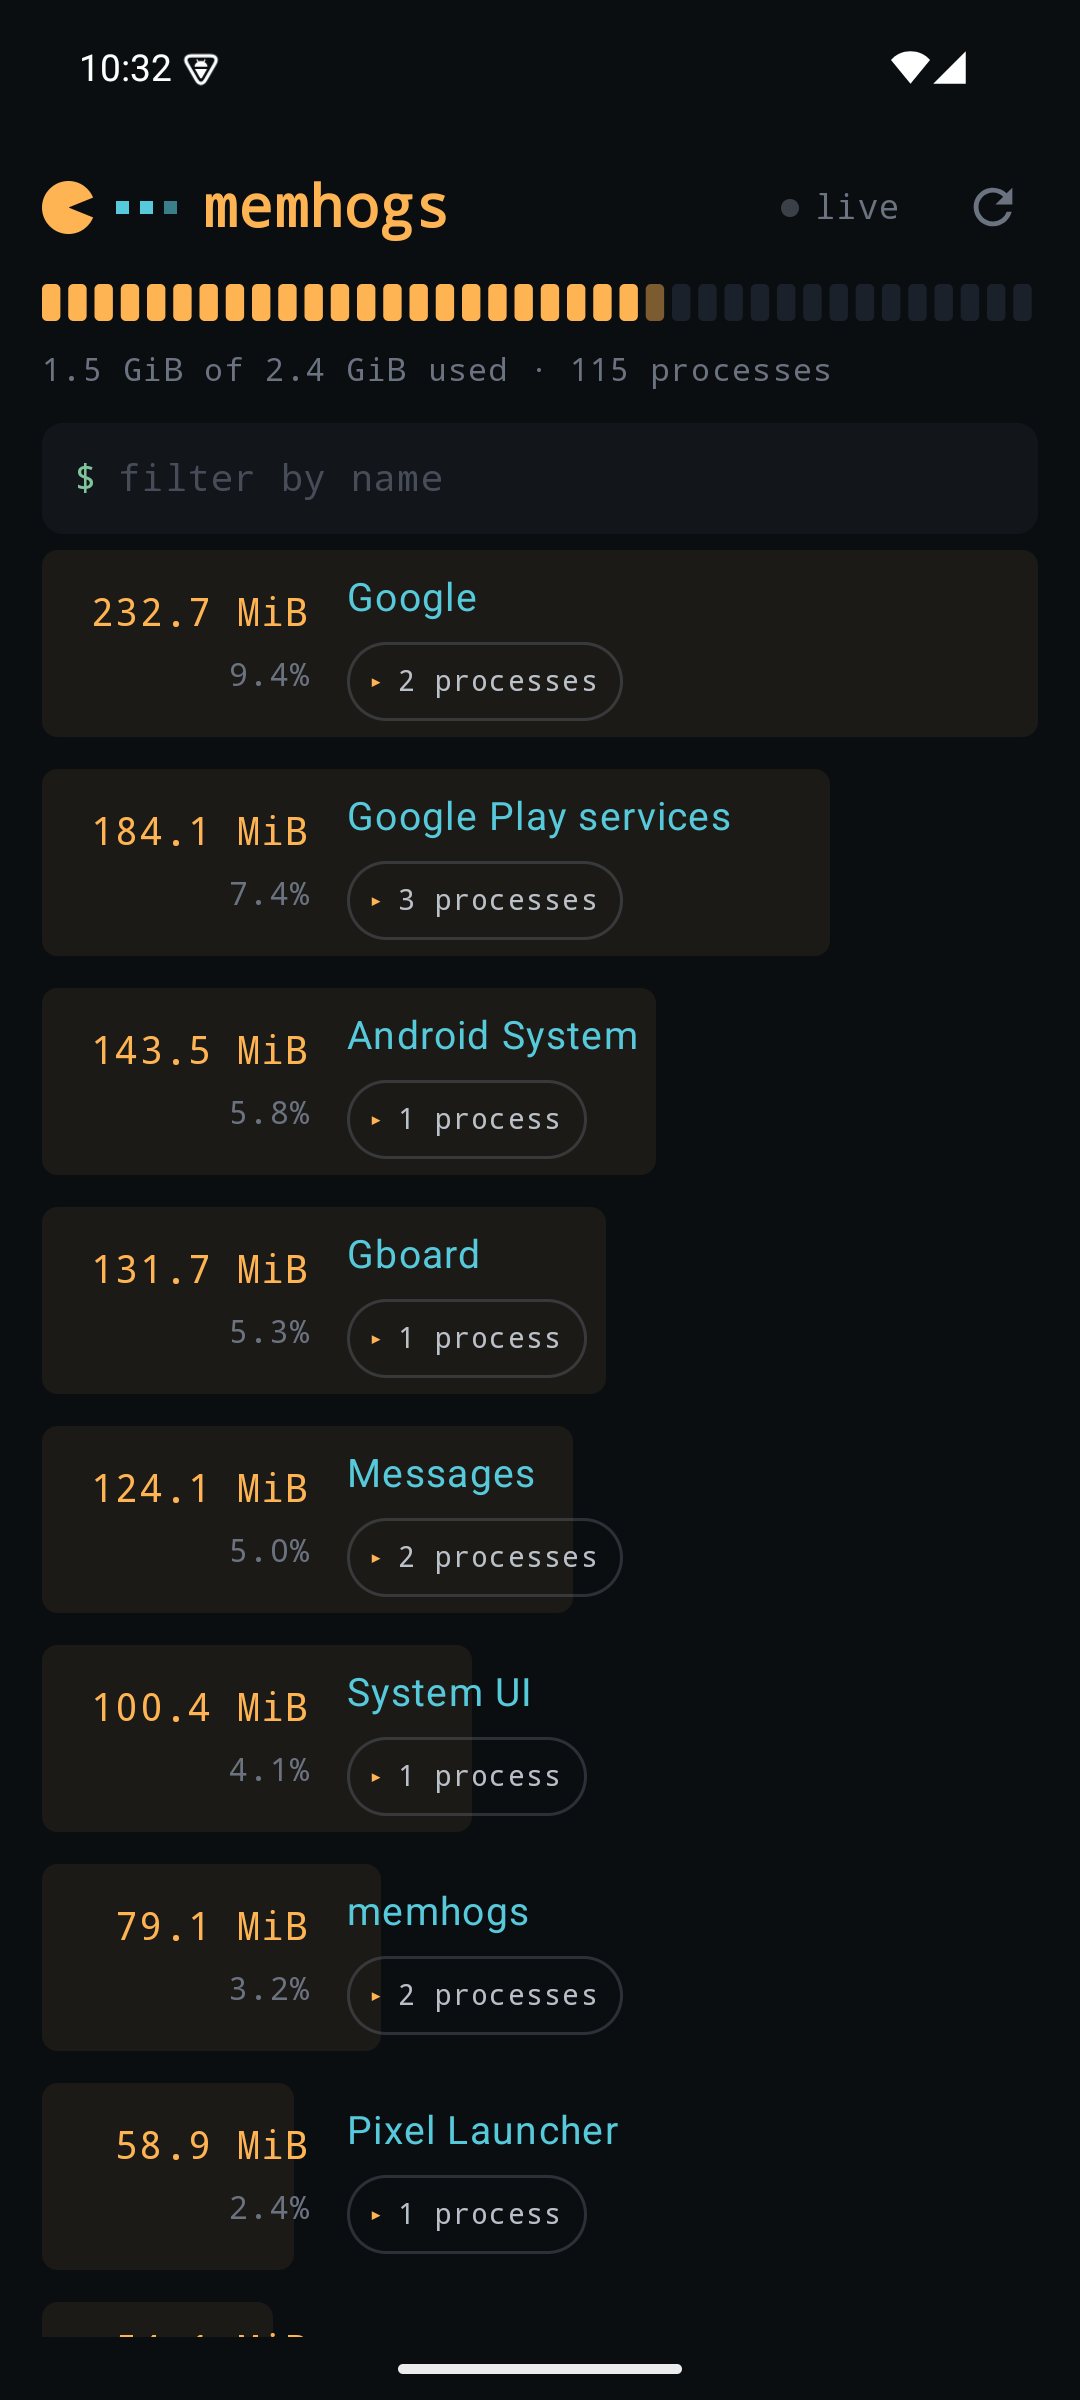
memhogs on a phone, apps ranked by memory with proportional bars
  1. Download the APK from the releases page and open it. If Android asks, allow installs from your browser. Requires Android 8 or newer.
  2. Install Shizuku from the Play Store, or from its GitHub releases if the Play Store claims it is incompatible with a brand-new Android version. Android hides other apps' memory from normal apps; Shizuku unlocks it the way a USB debugger would, no root needed.
  3. Start the Shizuku service inside the Shizuku app via wireless debugging. One tap, once per boot.
  4. Open memhogs and grant access. The per-app breakdown appears; tap any app to see its processes or reclaim its background memory.

Reclaim kills background processes only, the same thing Android does under memory pressure, so nothing you have open is touched. Without Shizuku the app still shows the device-wide gauge.

06A short field guide to process memory

"How much memory is that app using?" has several honest answers. Here is what the abbreviations mean and why the tools disagree.

A process reserves a large range of addresses (its virtual memory), but only some of that is real. Pages it has actually touched sit in RAM; pages it shares with other processes (system libraries, or an Electron framework mapped into every renderer) sit in RAM once, no matter how many processes use them; rarely-touched pages get compressed in place or swapped to disk. Every memory metric is just a choice about which of those pieces to count.

private pages shared pages compressed not counted
RSS
counts shared pages in full, in every process
PSS
shared pages split fairly: 1/N per process
footprint
skips shared file-backed pages, sees compressed memory

RSS Resident Set Size

The pages a process has physically in RAM right now. It's what ps and top report. Honest for one process, misleading when you sum: forty helpers sharing one framework each count it again.

PSS Proportional Set Size

Linux's fair version of RSS. A page shared by ten processes counts one tenth toward each, so PSS values sum to the truth. Read from /proc/<pid>/smaps_rollup.

footprint physical memory footprint

macOS's answer, and the number Activity Monitor shows. Counts private and compressed memory but not shared framework code, so summing is fair. That is why an idle app can appear to grow: its untouched pages compress, and footprint sees them while RSS forgets them.

%MEM

A process's (or in memhogs, a whole app's) share of the machine's physical RAM. The column that answers "is 700 MiB a lot on this box?"

swap & compression

Under pressure the OS evicts cold pages, either to a compressed store in RAM (fast) or to disk (slow). Those pages leave RSS entirely, which is how a leaking process can look like it's shrinking.

virtual size VSZ

Address space the process has reserved, most of it never touched. Browsers reserve terabytes. Ignore this column; everyone else does.

memhogs defaults to footprint on macOS and PSS on Linux so that group totals don't double-count, and falls back to RSS for processes the OS won't let it inspect. --rss switches everything back when you need numbers comparable with ps.

07Missing a flag?

Feature requests are tracked as GitHub issues, so you can browse what's been asked for and vote with a thumbs-up. This prompt is a shortcut:

# type your idea and hit enter to open a prefilled GitHub issue
$memhogs --request ""